Note · 2026-08-11
The gap nobody prices: what "basis risk" really means for a wind farm
Parametric insurance has a genuinely beautiful idea at its centre. Instead of sending a loss adjuster to argue about your damage for months, you agree in advance on a weather number — a wind speed, an irradiance level, a river gauge — and if the number crosses a line, the money moves. Automatically. In days, not quarters.
The whole idea rests on one quiet assumption: that the number is a good stand-in for your actual loss. When it isn't, you get basis risk — the gap between what the index pays and what you actually lost. It is the single most important concept in this market, and it is routinely under-measured.
Let me make it concrete, because "basis risk" sounds abstract until it's your money.
A wind farm's bad year
Imagine a wind farm that buys cover against a "wind drought" — a stretch of unusually calm weather where the turbines barely turn. The cover pays off an index built from reanalysis wind speeds over the region. Sensible. Cheap. Fast.
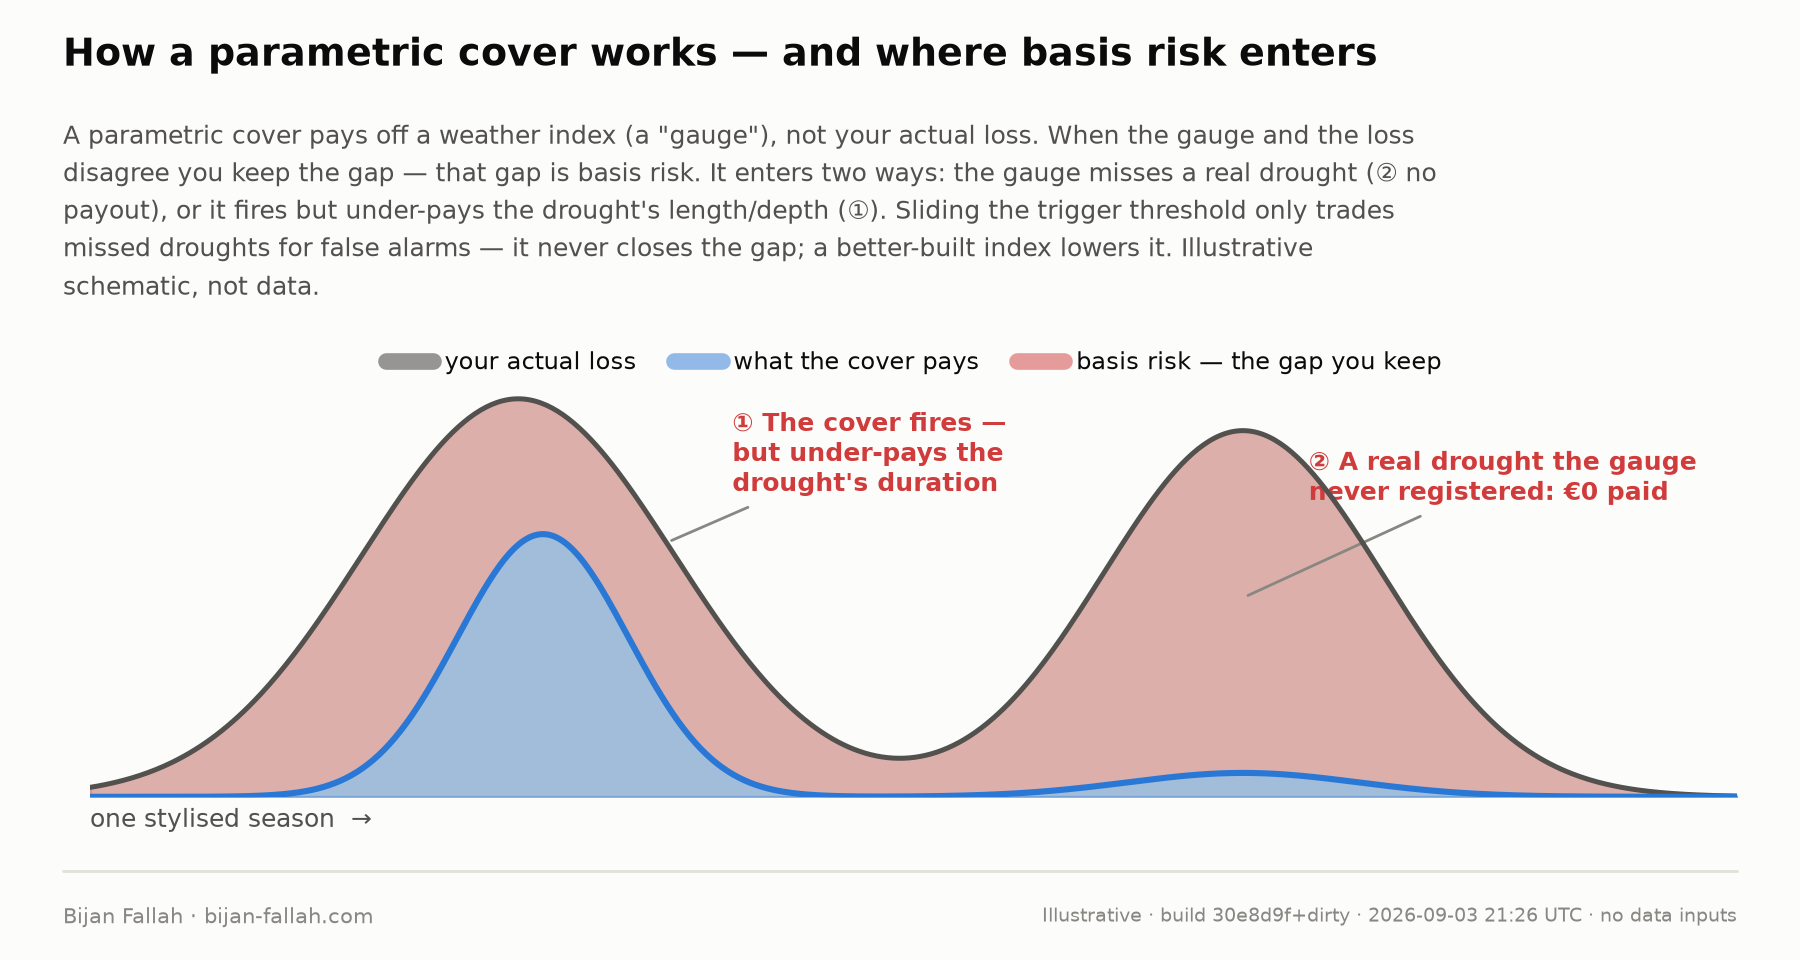
Now the calm spell arrives. Two things can go wrong, and they are different things:
- The whole event is missed. The wind was low enough to hurt the farm's revenue, but the index — measured a little differently, or averaged over a slightly wider area — never quite crossed its threshold. You lost money; the cover paid nothing.
- The event is under-paid. The index fires, but it pays for, say, three bad days when you actually suffered six. The cover recognises the drought but not its full depth.
Both are basis risk. The first is the dramatic one that ends up in the newspaper. The second is the quiet one that erodes the value of the cover every single year, and it's the one almost nobody quantifies.
Why this happens even when the index is "good"
Here's the part that surprises people. You can build an index that is strongly correlated with the farm's output — 0.97, 0.98, the kind of number that makes a committee nod — and still leave a large slice of loss unpaid.
Correlation measures whether the index and the loss move together on average. It says almost nothing about whether they agree in the specific events that matter — the deepest, rarest droughts, which are exactly where the payout is supposed to save you. A high headline correlation can sit on top of a trigger that consistently under-pays the worst events. The flattering number and the dangerous behaviour coexist happily.
This is why "our index correlates at 0.98" is not an answer to "will it pay me when I'm actually hurt." Those are different questions, and only the second one matters when the wind stops.
The point of measuring it
None of this makes parametric cover a bad product. It makes it a product that needs an honest number attached to it — a measured basis risk, for this trigger, on this risk, so the buyer knows what they're actually transferring and what they're quietly keeping.
That measurement is the work I'm building a practice around: not selling you a trigger, and not placing your risk, but independently telling you how big the gap is — and, if it's too big, how to shrink it. In the next pieces I'll put real numbers on exactly this, using public data on European wind and solar: how much of a drought a fairly-built index still leaves on the table, and why solar is worse than wind.
This is part of a series on how well weather triggers track the losses they're meant to cover. If you build, buy, or carry parametric energy risk, I'd like to hear how the gap shows up on your side of the market.
Disclaimer — published in a personal capacity, under my own name. This is independent work: produced entirely on my own time and my own equipment, from public data (ERA5 reanalysis; ENTSO‑E generation), using no resources, data, or working time of any employer, and outside my assigned duties. It carries no institutional affiliation and is neither connected with nor endorsed by any employer or institution; the views are mine alone. It is not financial, actuarial, or legal advice, and nothing here is an offer of services.