Note · 2026-08-07
The sea I swam in: four independent datasets on a Mediterranean warming twice as fast as the ocean
I went swimming in the Mediterranean this summer. The water was warm — not pleasant-warm, bath-warm. It felt wrong enough that I did what I do professionally and checked whether my memory was exaggerating.
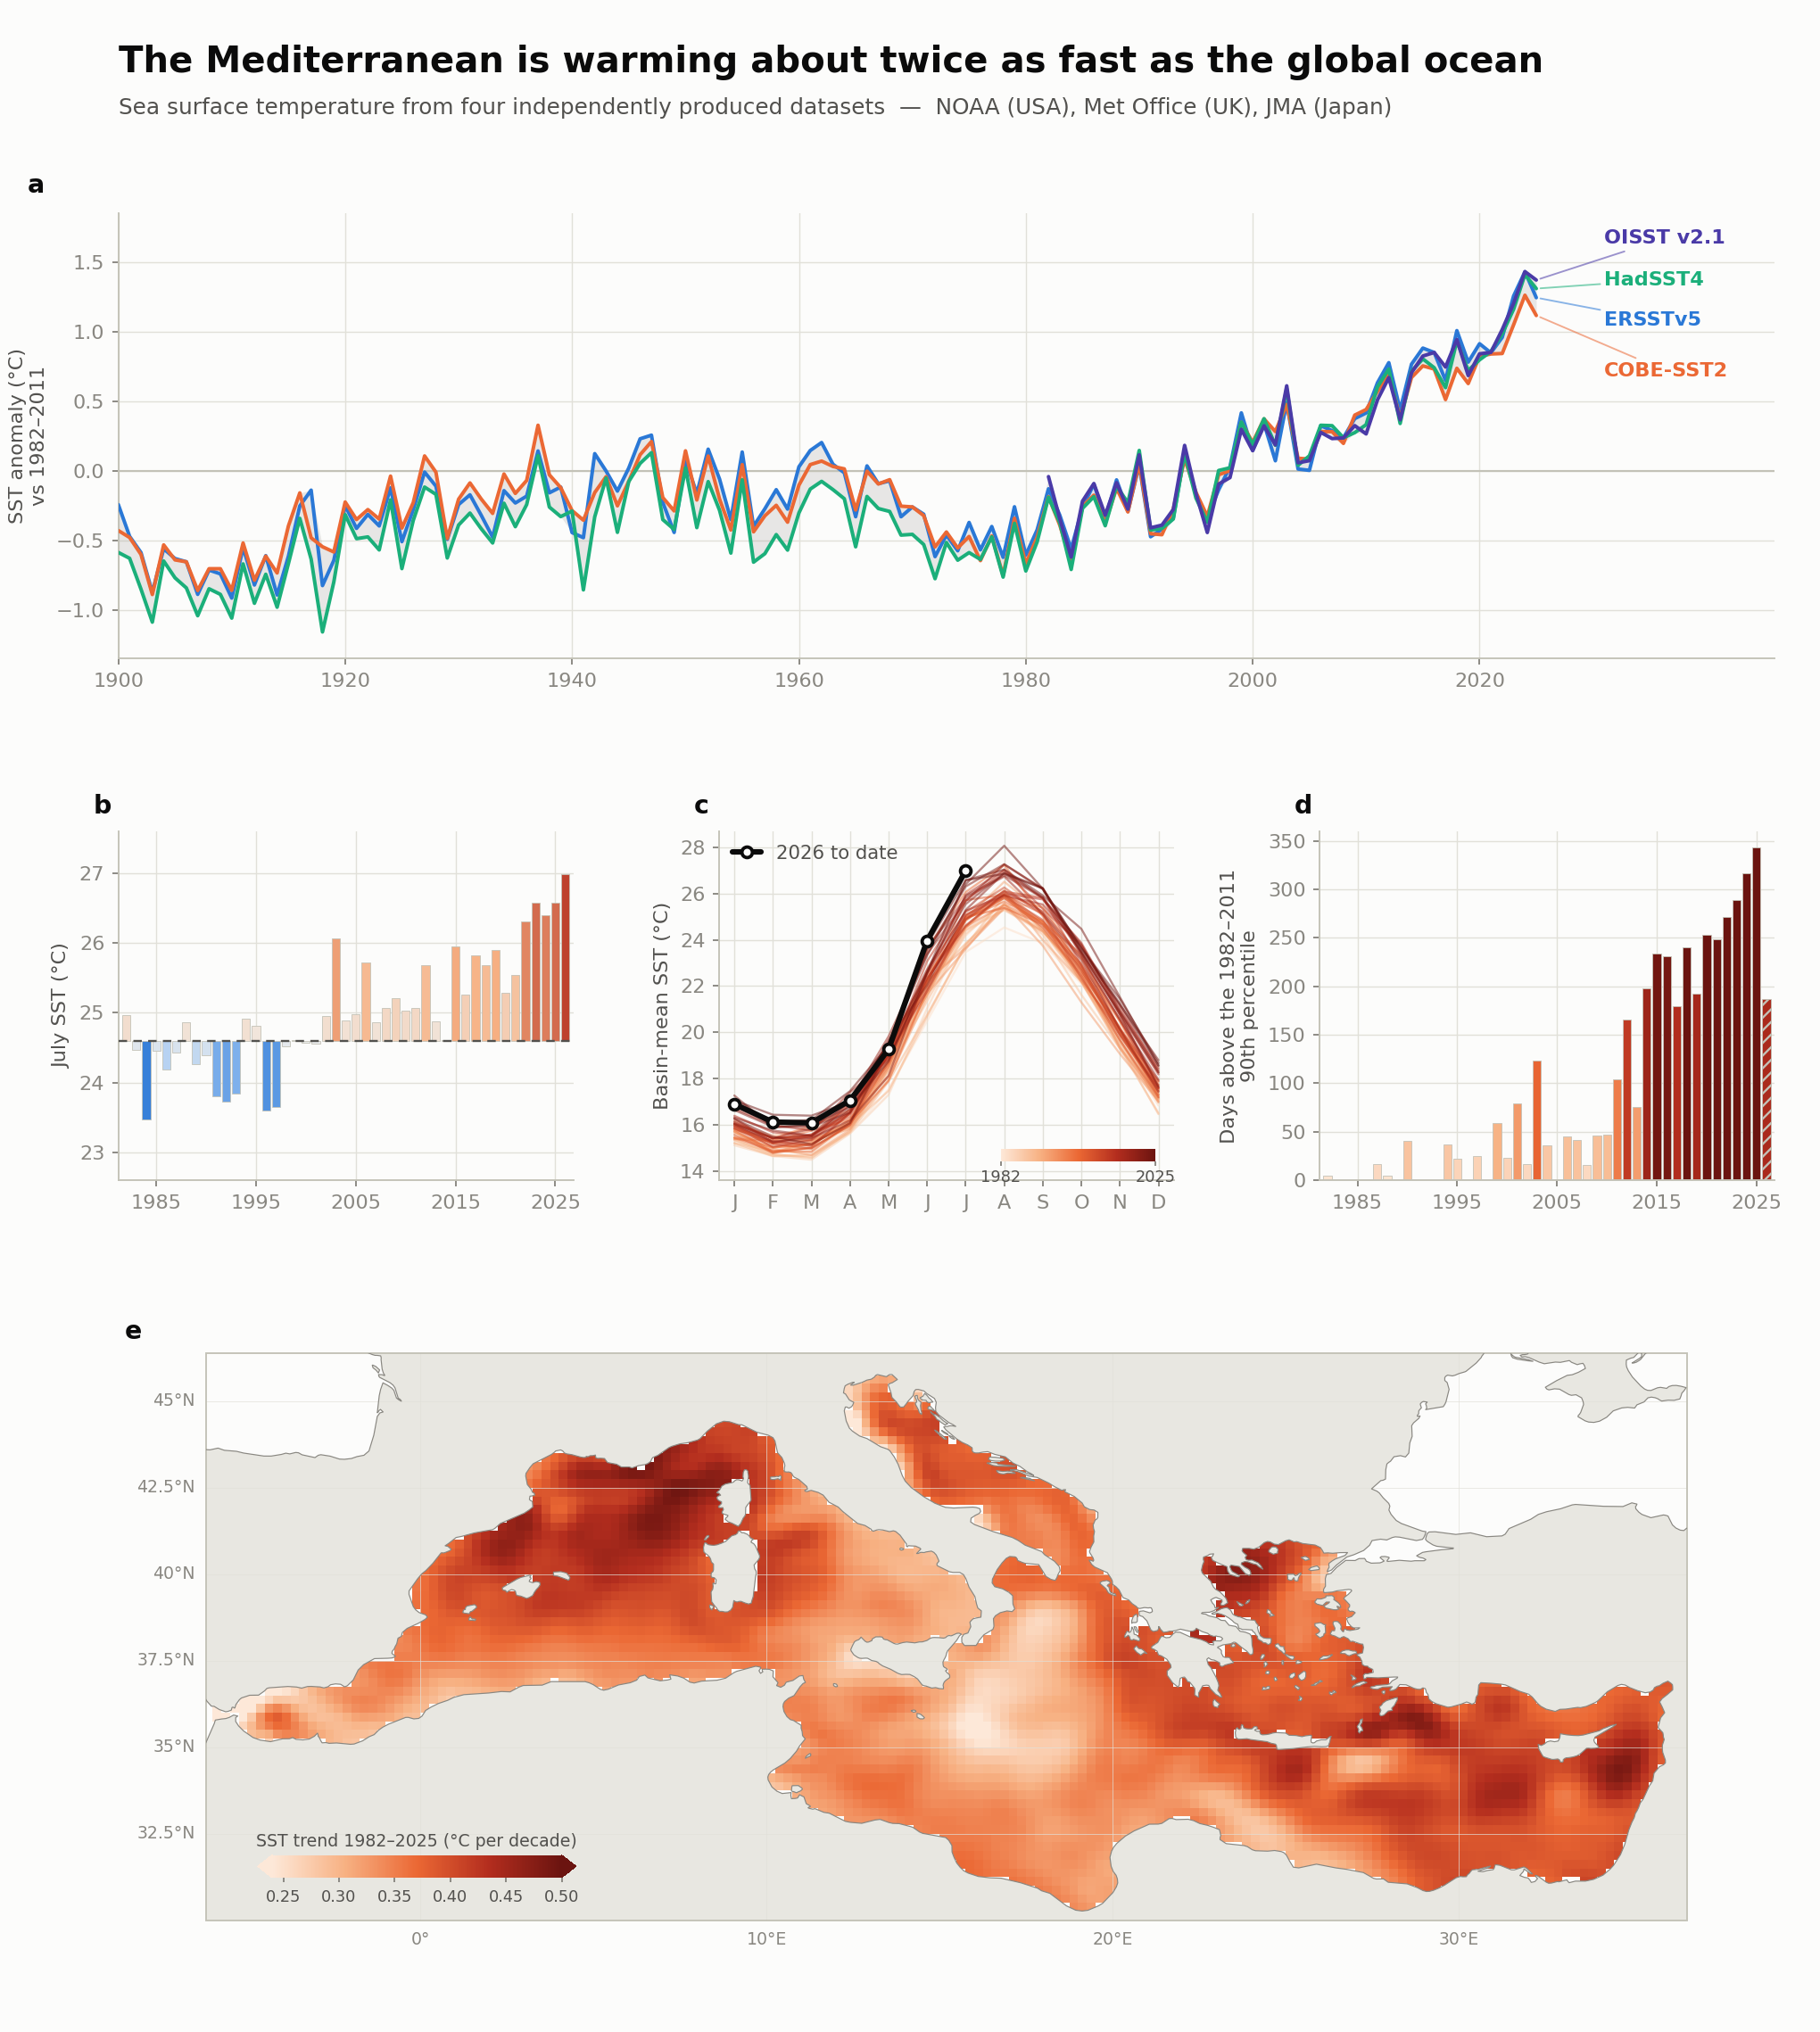
It was not. In July 2026 the Mediterranean's basin-mean surface temperature was 27.0 °C — 2.4 °C above the 1982–2011 average for that month, and the warmest July in the 45-year satellite record. June 2026 had already broken its own record (23.96 °C against 2025's 23.80). I was swimming in the statistic.
One sea, measured four ways
A single warm month is an anecdote, and a single dataset can mislead — every long temperature record is stitched together from instruments that changed over the decades. So I put four sea-surface-temperature products side by side, built by different institutions, from different observations, with different methods:
- ERSST v5 — NOAA (USA), ships and buoys only
- HadSST4 — Met Office Hadley Centre (UK), ships and buoys, deliberately non-interpolated
- COBE-SST2 — Japan Meteorological Agency, its own analysis system
- OISST v2.1 — NOAA satellite infrared, a different observing system entirely
Four processing chains, four teams, three countries. On the Mediterranean, they land in the same place:
- +0.35 to +0.38 °C per decade since 1982 — the four agree to within about 4%
- roughly twice the global-ocean rate — 2.0–2.7× depending on the product; the spread in that ratio comes almost entirely from how each product measures the global ocean, not from any disagreement about the Mediterranean
- over the full 1900–2025 record the century-scale trend is +0.09 to +0.11 °C per decade — the basin is now warming three to four times faster than its twentieth-century pace
What that means at the beach
The June–September swimming season has warmed by about 1.8 °C since 1982 — from 23.7 to 25.5 °C on the fitted trend. And the warming is not evenly spread across the year: comparing 2016–2025 with 1982–1991, the summer months are about +1.6 °C warmer while late winter is about +0.8 °C — summer is warming twice as fast as winter. The warmest August on record was 2024, at a basin mean of 28.1 °C.
The trend map settles a question the basin averages cannot: this is not one warm corner pulling up the mean. Every single grid cell in the basin is warming — the middle half of the basin's cells trend between +0.30 and +0.43 °C per decade, with the median at +0.37.
The number that stopped me
In 1982 the basin spent 5 days above what was then its 90th-percentile temperature for the time of year, counting only spells that lasted five days or more. In 2003 — the summer Europe remembers — it was 123. In 2025 it was 343 days out of 365. By the end of this July, 2026 had already logged 187 of a possible 212.
Read that honestly: the metric saturates by design. Against a fixed 1982–2011 baseline, 343 days does not mean 343 heatwaves — it means the sea state that was once a one-in-ten-days extreme has become the ordinary condition. I know no cleaner way to say the baseline has moved.
And yes — the Mediterranean really is saltier than the Atlantic: evaporation exceeds what rain and rivers return, which keeps it near 38–39 g/kg against roughly 35 for the open ocean. That part is textbook background, not something this analysis computed. The temperature is another matter.
The caveat that matters
No two SST datasets are fully independent. All of them ultimately reach back into the same ICOADS archive of ship and buoy measurements. What genuinely differs is who processed them and how they corrected for the fact that a canvas bucket hauled over the side of a 1900s steamer, an engine-room intake, a drifting buoy and a satellite radiometer all measure something slightly different. The claim the figure supports is that four independent attempts at that correction converge on the same curve — that, not any single line, is the result. A second honest limitation: the coarser in-situ products (ERSST at 2°, HadSST4 at 5°) have cells that straddle coastlines; their close agreement with the 0.25° satellite product is the check that coastal mixing is not driving the basin means.
Method, in one paragraph
Basin means are area-weighted over Mediterranean water cells, with the Black Sea and the Sea of Marmara excluded explicitly. Anomalies are relative to the 1982–2011 monthly climatology — the one 30-year window all four products cover in full. Trends are ordinary least squares on annual means; the extreme-day count uses a seasonally varying 90th percentile from an 11-day window on the 1982–2011 climatology, requiring runs of at least five consecutive days. Panels b–e of the figure use OISST v2.1. Every archive used here is openly published — by NOAA PSL, the Met Office Hadley Centre, and the Japan Meteorological Agency — and every number above recomputes from them.
Disclaimer — published in a personal capacity, under my own name. This is independent work: produced entirely on my own time and my own equipment, from public data (NOAA ERSST v5 and OISST v2.1, Met Office HadSST4, and JMA COBE-SST2 — all openly published archives), using no resources, data, or working time of any employer, and outside my assigned duties. It carries no institutional affiliation and is neither connected with nor endorsed by any employer or institution; the views are mine alone. It is not financial, actuarial, or legal advice, and nothing here is an offer of services.