Python codes available at kaggle
Based on the data from the German Weather Service DWD, I plotted the near surface air temperature averaged for each year and over each state (Bundesland) for Germany. The data starts from 1881 up to present. First we take a look at the Carbone Dioxide CO2 levels in the atmosphere during the last Millennium:
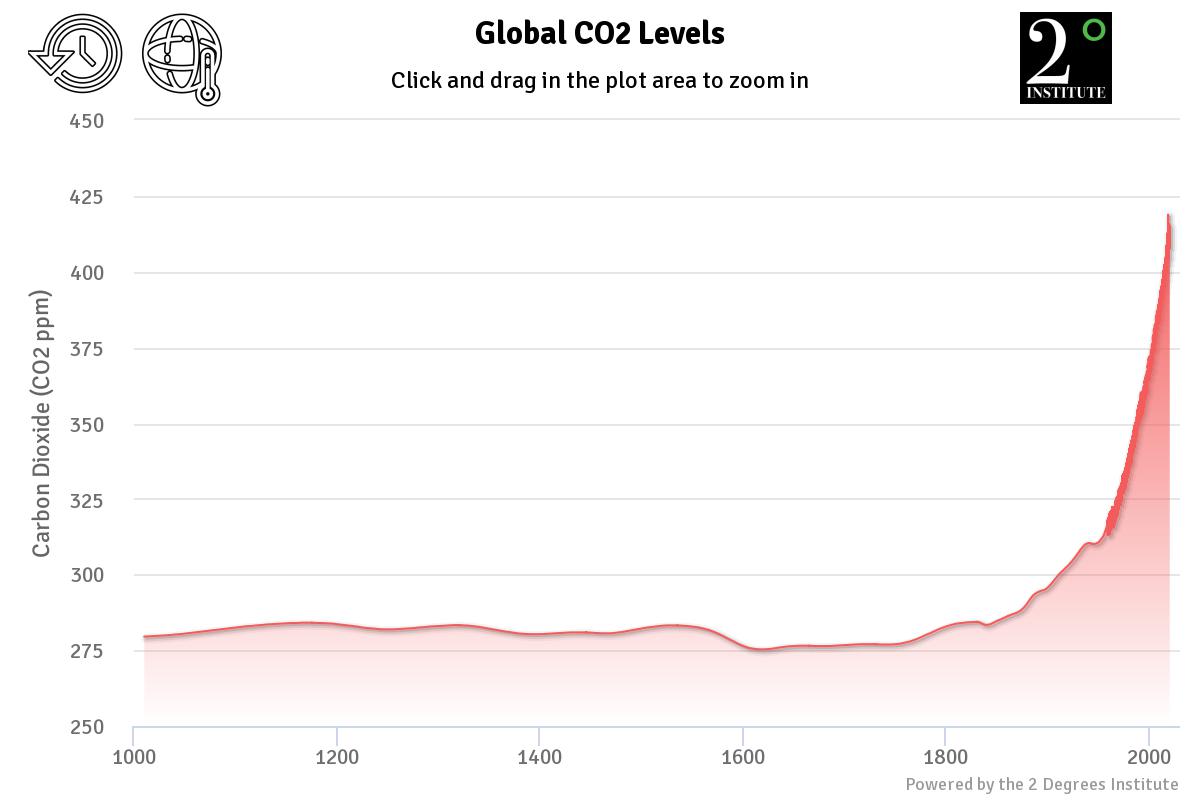 Global CO2 levels in ppm for the last Millennium. The plot is from 2 degrees institute.
As can be seen in the plot since 1850 onwards, the CO2 levels are rising up and we reached the maximum at the present time. This rising will continue probably with the current political decisions taken from influential countries around the world.
Temperature Trends in Germany
The question is what this rising trend will do with the climate in Germany for example? Lets see how the temperature is changing in different states around the Germany. The following figure is showing the near surface annual mean temperature over Germany from 1881 to 2018 for each state. Usually the climate is defined as the 30 years mean of the weather situation. Which means how the mean weather state is in a long period of 30 years. The maps show 30 years mean of temperatures in states of Germany in 2 periods: the left map, first 30 years on the record (1881 to 1910) and the right map, last 30 years (1989-2018).
 Near surface annual mean temperature over Germany from 1881 to 2018.
You could already see a significant warming over the whole country. In order to show this difference, I plot another map which shows the difference between this 2 maps, I mean the period 1989-2018 minus 1881-1910.
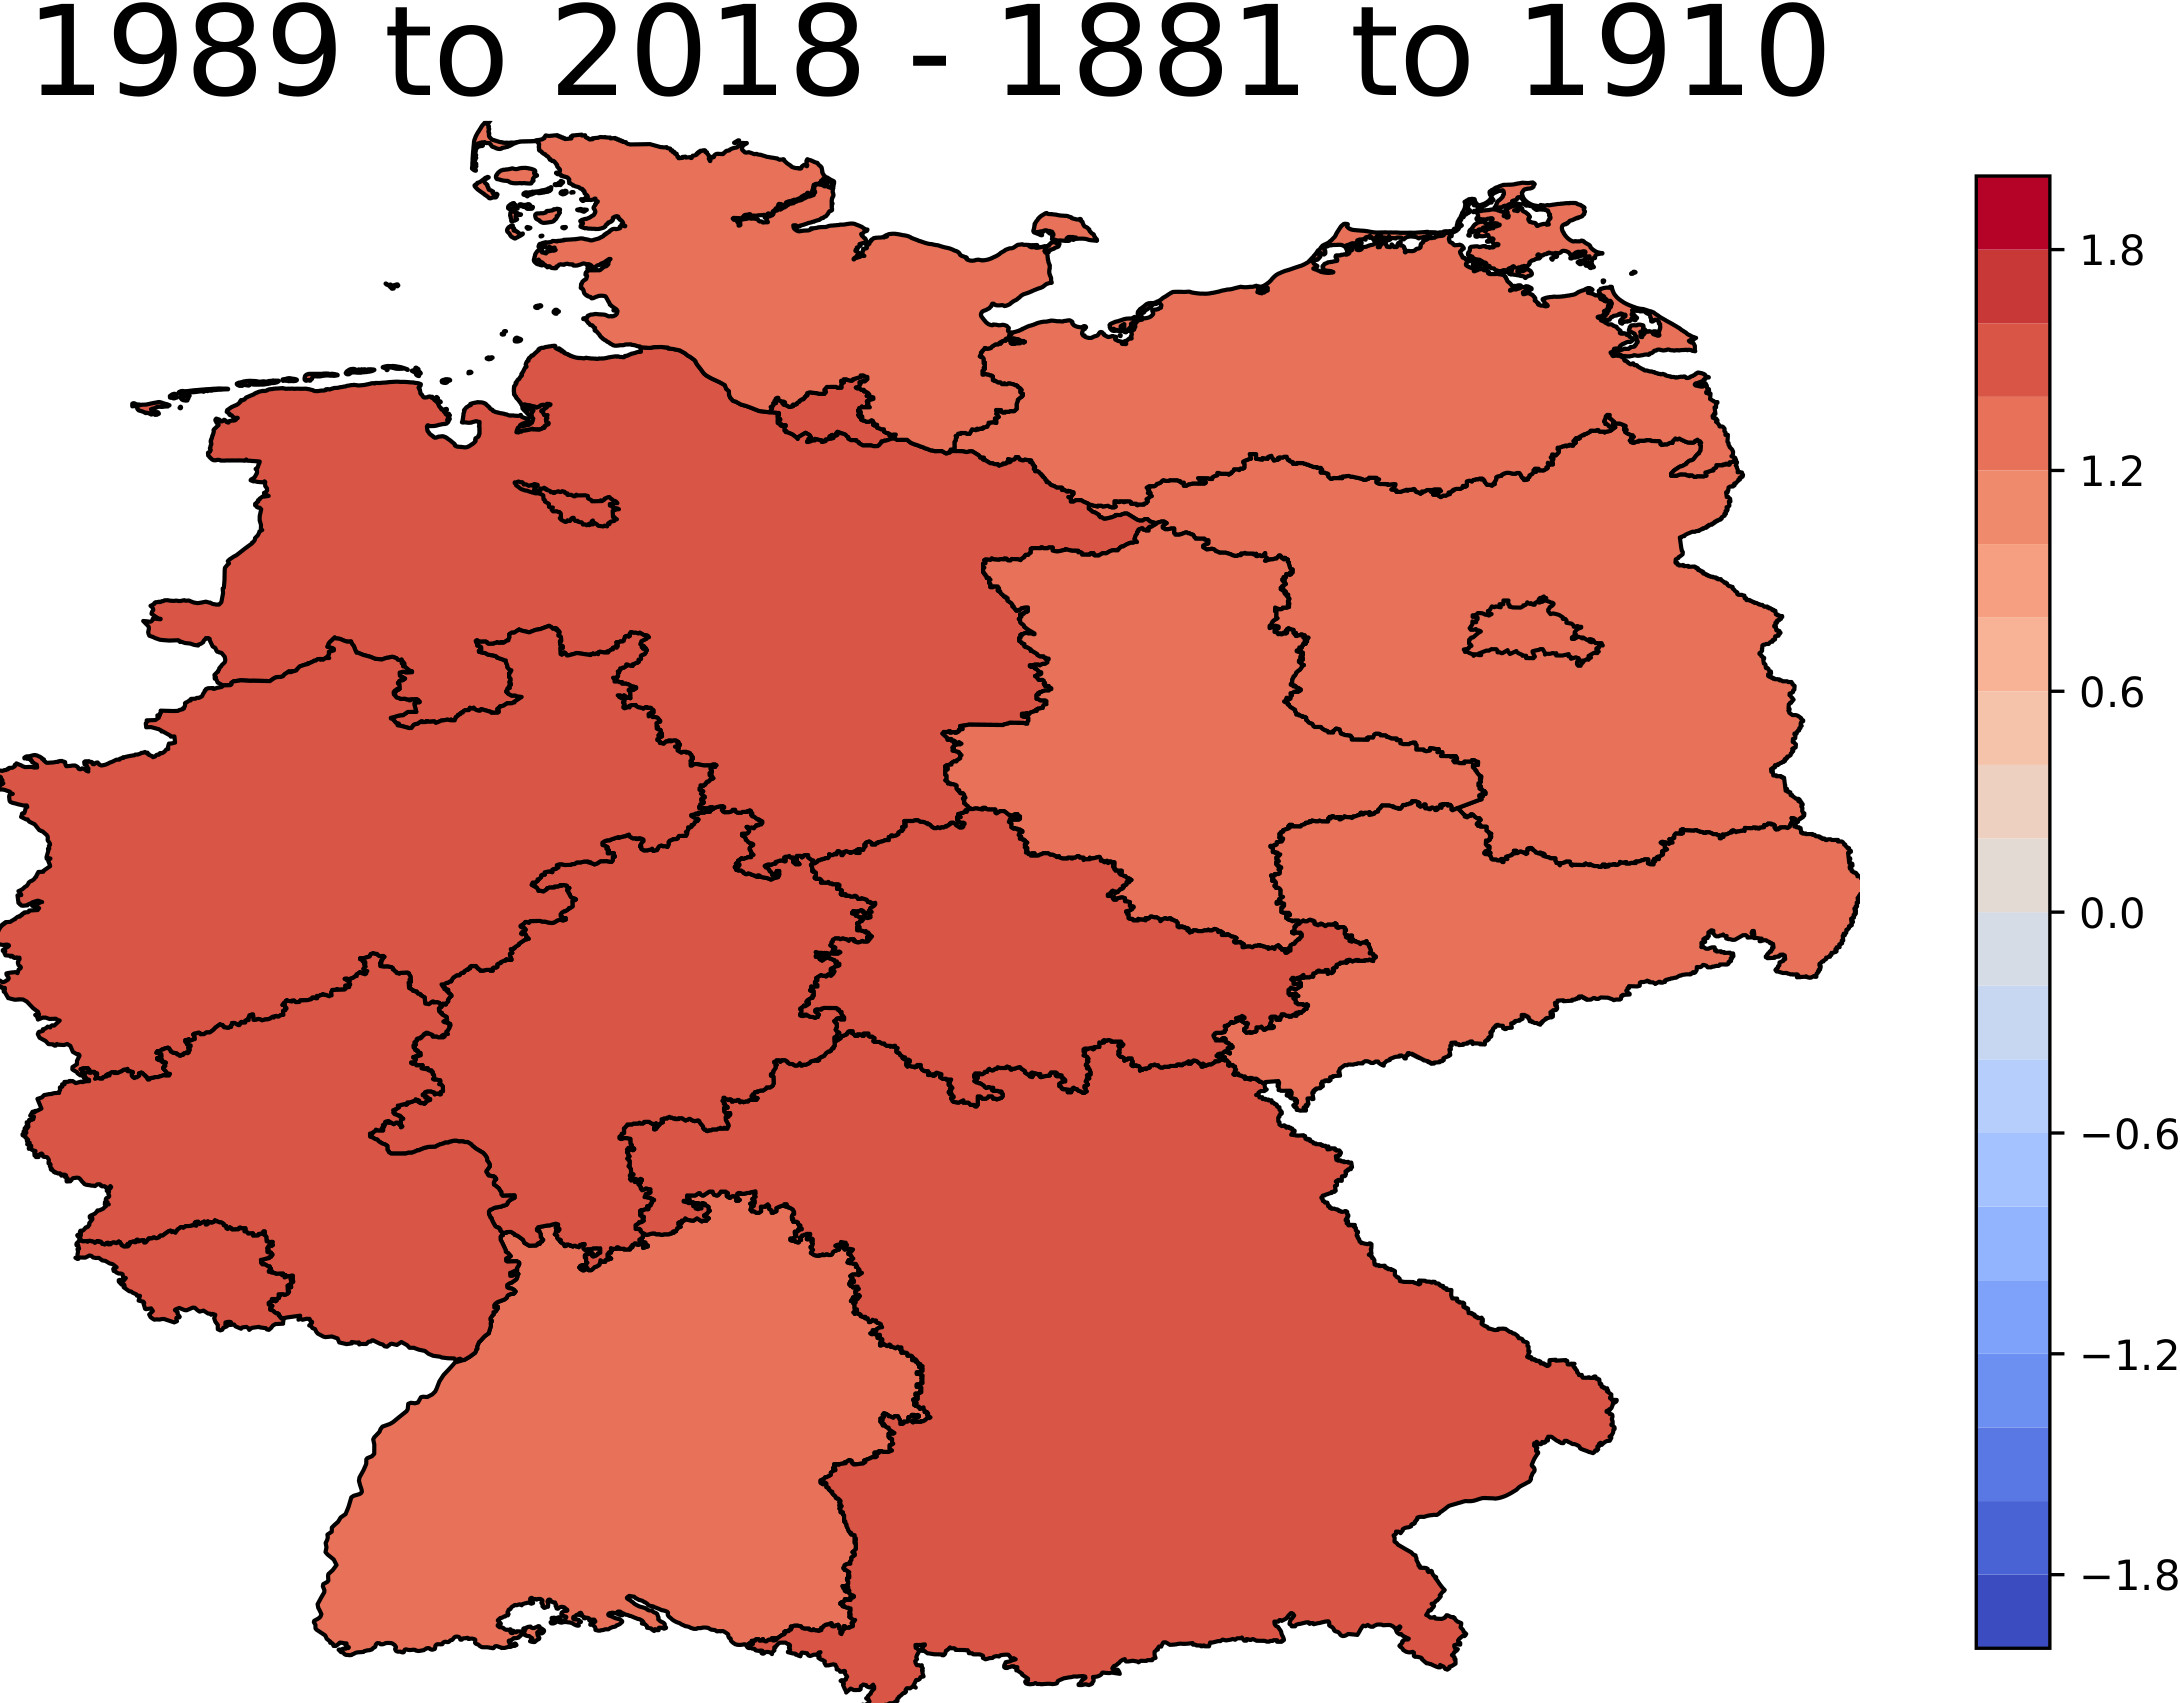 Near surface annual mean temperature over Germany_ difference between 1881-1910 and 1989-2018. xs
It is schocking yes? Well the ones who are not fan of the global warming facts may say such wrming patterns are natural. But please just look at this tweet:
Just a friendly reminder... pic.twitter.com/Qds24MoiCV
— Kris Karnauskas (@OceansClimateCU) August 8, 2018
Here, we see the CO2 levels in the past 800 thousand years up to the possible future scenarios in 2100. According to the plot on this tweet, we will continue to burn more CO2 at higher levels as today till 2100 in all so-called Representative Concentration Pathways (RCPs). RCPs show the scenarios for future emissions, concentrations, and land-use, ending with radiative forcing levels of 2.6, 4.5, 6.0, and 8.5 W/m2 by 2100. Strong mitigation policies result in a low forcing level (RCP2.6). Two medium stabilization scenarios lead to intermediate outcomes: (RCP4.5, RCP6.0) [IPCC]. What do you think? Are we doing anything to stabilize the CO2 emission?
Share if you liked it: